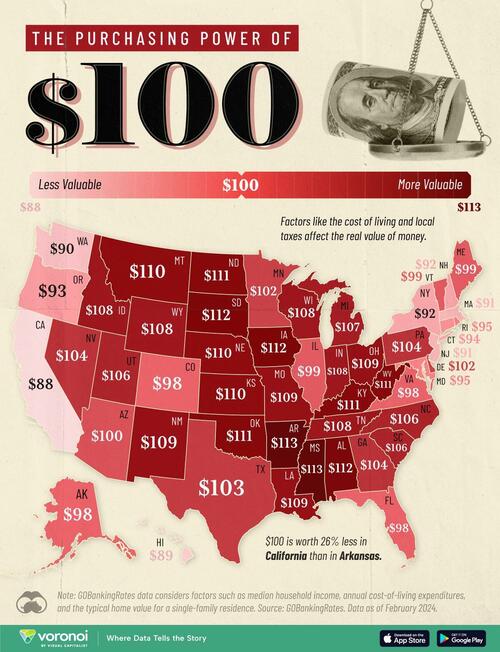
Mapping The Shocking Purchasing Power Disparity Of $100 In Each US State While $100 may seem like it holds the same value across the U.S., that’s far from the reality. The purchasing power of a dollar can vary significantly from state to state, influenced by factors such as the cost of food, utilities, taxes, housing, and transportation. This map, via Visual Capitalist’s Bruno Venditti, illustrates the purchasing power of $100 by state, using data from GOBankingRates compiled as of February 19, 2024. Methodology GOBankingRates compiled data from the 2022 Regional Price Parities reoporting by the U.S. Bureau of Economic Affairs. It then used factors… — Continue at ZeroHedge News : Read More
Home » Mapping The Shocking Purchasing Power Disparity Of $100 In Each US State – Tyler Durden
Mapping The Shocking Purchasing Power Disparity Of $100 In Each US State – Tyler Durden